NASA maps show 2026 El Niño resembling the 1997 event
By Staff Writer · Published 10/23/2026, 2:19:47 AM ET
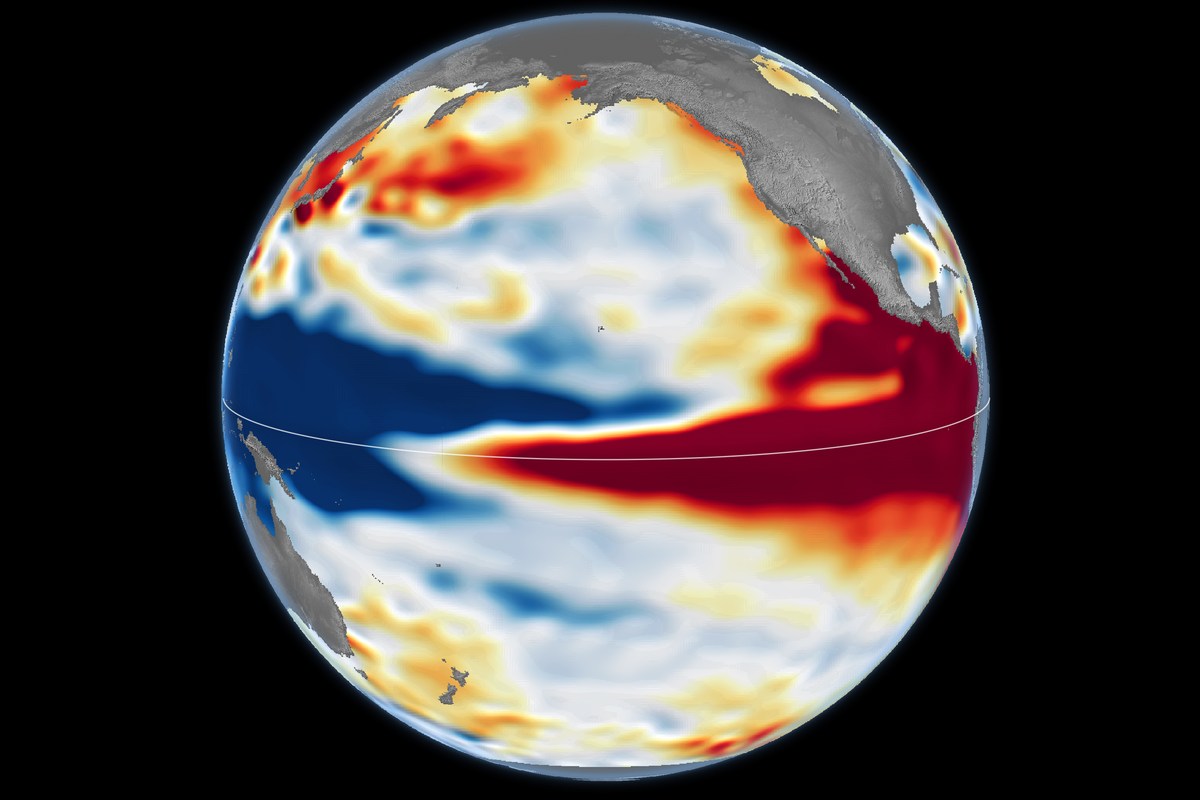
Sea-surface height anomalies on October 12, 2026. Red indicates higher-than-average levels and blue indicates lower levels; seasonal cycles and long-term trends have been removed.
NASA Earth Observatory / Lauren Dauphin; NASA-SSH data provided by Josh Willis, Severine Fournier and Kevin Marlis, NASA/JPL-Caltech. · Official image source · NASA media-use guidelines permit factual informational news use with source acknowledgment; this NASA Earth Observatory map has no third-party copyright marking. No endorsement implied.Satellite measurements find a similar Pacific sea-level pattern, but NASA cautions that the resemblance cannot settle this winter’s local weather.
NASA’s latest satellite comparison shows the developing 2026 El Niño has an ocean pattern resembling the powerful 1997–98 event, with unusually high sea levels across the central and eastern equatorial Pacific. The agency’s October 23 report cautions that a similar ocean pattern does not guarantee the same weather outcomes.
NASA Earth Observatory compares measurements from October 13, 1997, with October 12, 2026. The earlier observations came from TOPEX/Poseidon; this year’s came from Sentinel-6 Michael Freilich. Scientists at NASA’s Jet Propulsion Laboratory processed the data.
The maps use sea-surface height as an indicator of ocean heat: water expands as it warms. Seasonal changes and long-term trends have been removed from the comparison to make short-term patterns easier to see. Red areas mark water standing above its usual height, while blue marks lower levels.
This year, as in 1997, the higher water extends along the equator toward South America. NASA contrasts that pattern with October 2015, when the elevated water remained farther offshore despite another very strong El Niño. The agency says the distribution of warm water helped produce different weather effects during the 2015–16 event.
Josh Willis, the JPL scientist for sea-level missions cited in the report, says overlapping satellite missions provide about 35 years of comparable measurements. He says the 2026 event developed more abruptly than its 1997 predecessor and could become larger, while emphasizing uncertainty about how atmospheric conditions will translate it into weather.
NOAA’s October 8 outlook put the chance of a strong-to-very strong El Niño through January–March 2027 at more than 83%. Its Climate Prediction Center scheduled the next monthly ENSO discussion for November 12. These are forecast probabilities and a planned update, not observed winter results.
NASA points to the heavy rain that affected California and the southern United States in 1997–98 as one possible comparison. That is historical context and a qualified outlook, rather than confirmation that those places will experience the same conditions in winter 2026–27.
What it means
The satellite record gives scientists a consistent way to compare the ocean conditions behind major El Niño events. It does not turn a Pacific-wide resemblance into a local rain, drought or flood forecast. NASA’s report stresses that the atmosphere can alter how the signal reaches places outside the tropics, leaving the timing and location of this winter’s effects uncertain.
Source
This State & Nation summary is based on NASA Earth Observatory’s original release, dated 2026-10-23. The reporting above is attributed to the official sources linked here.